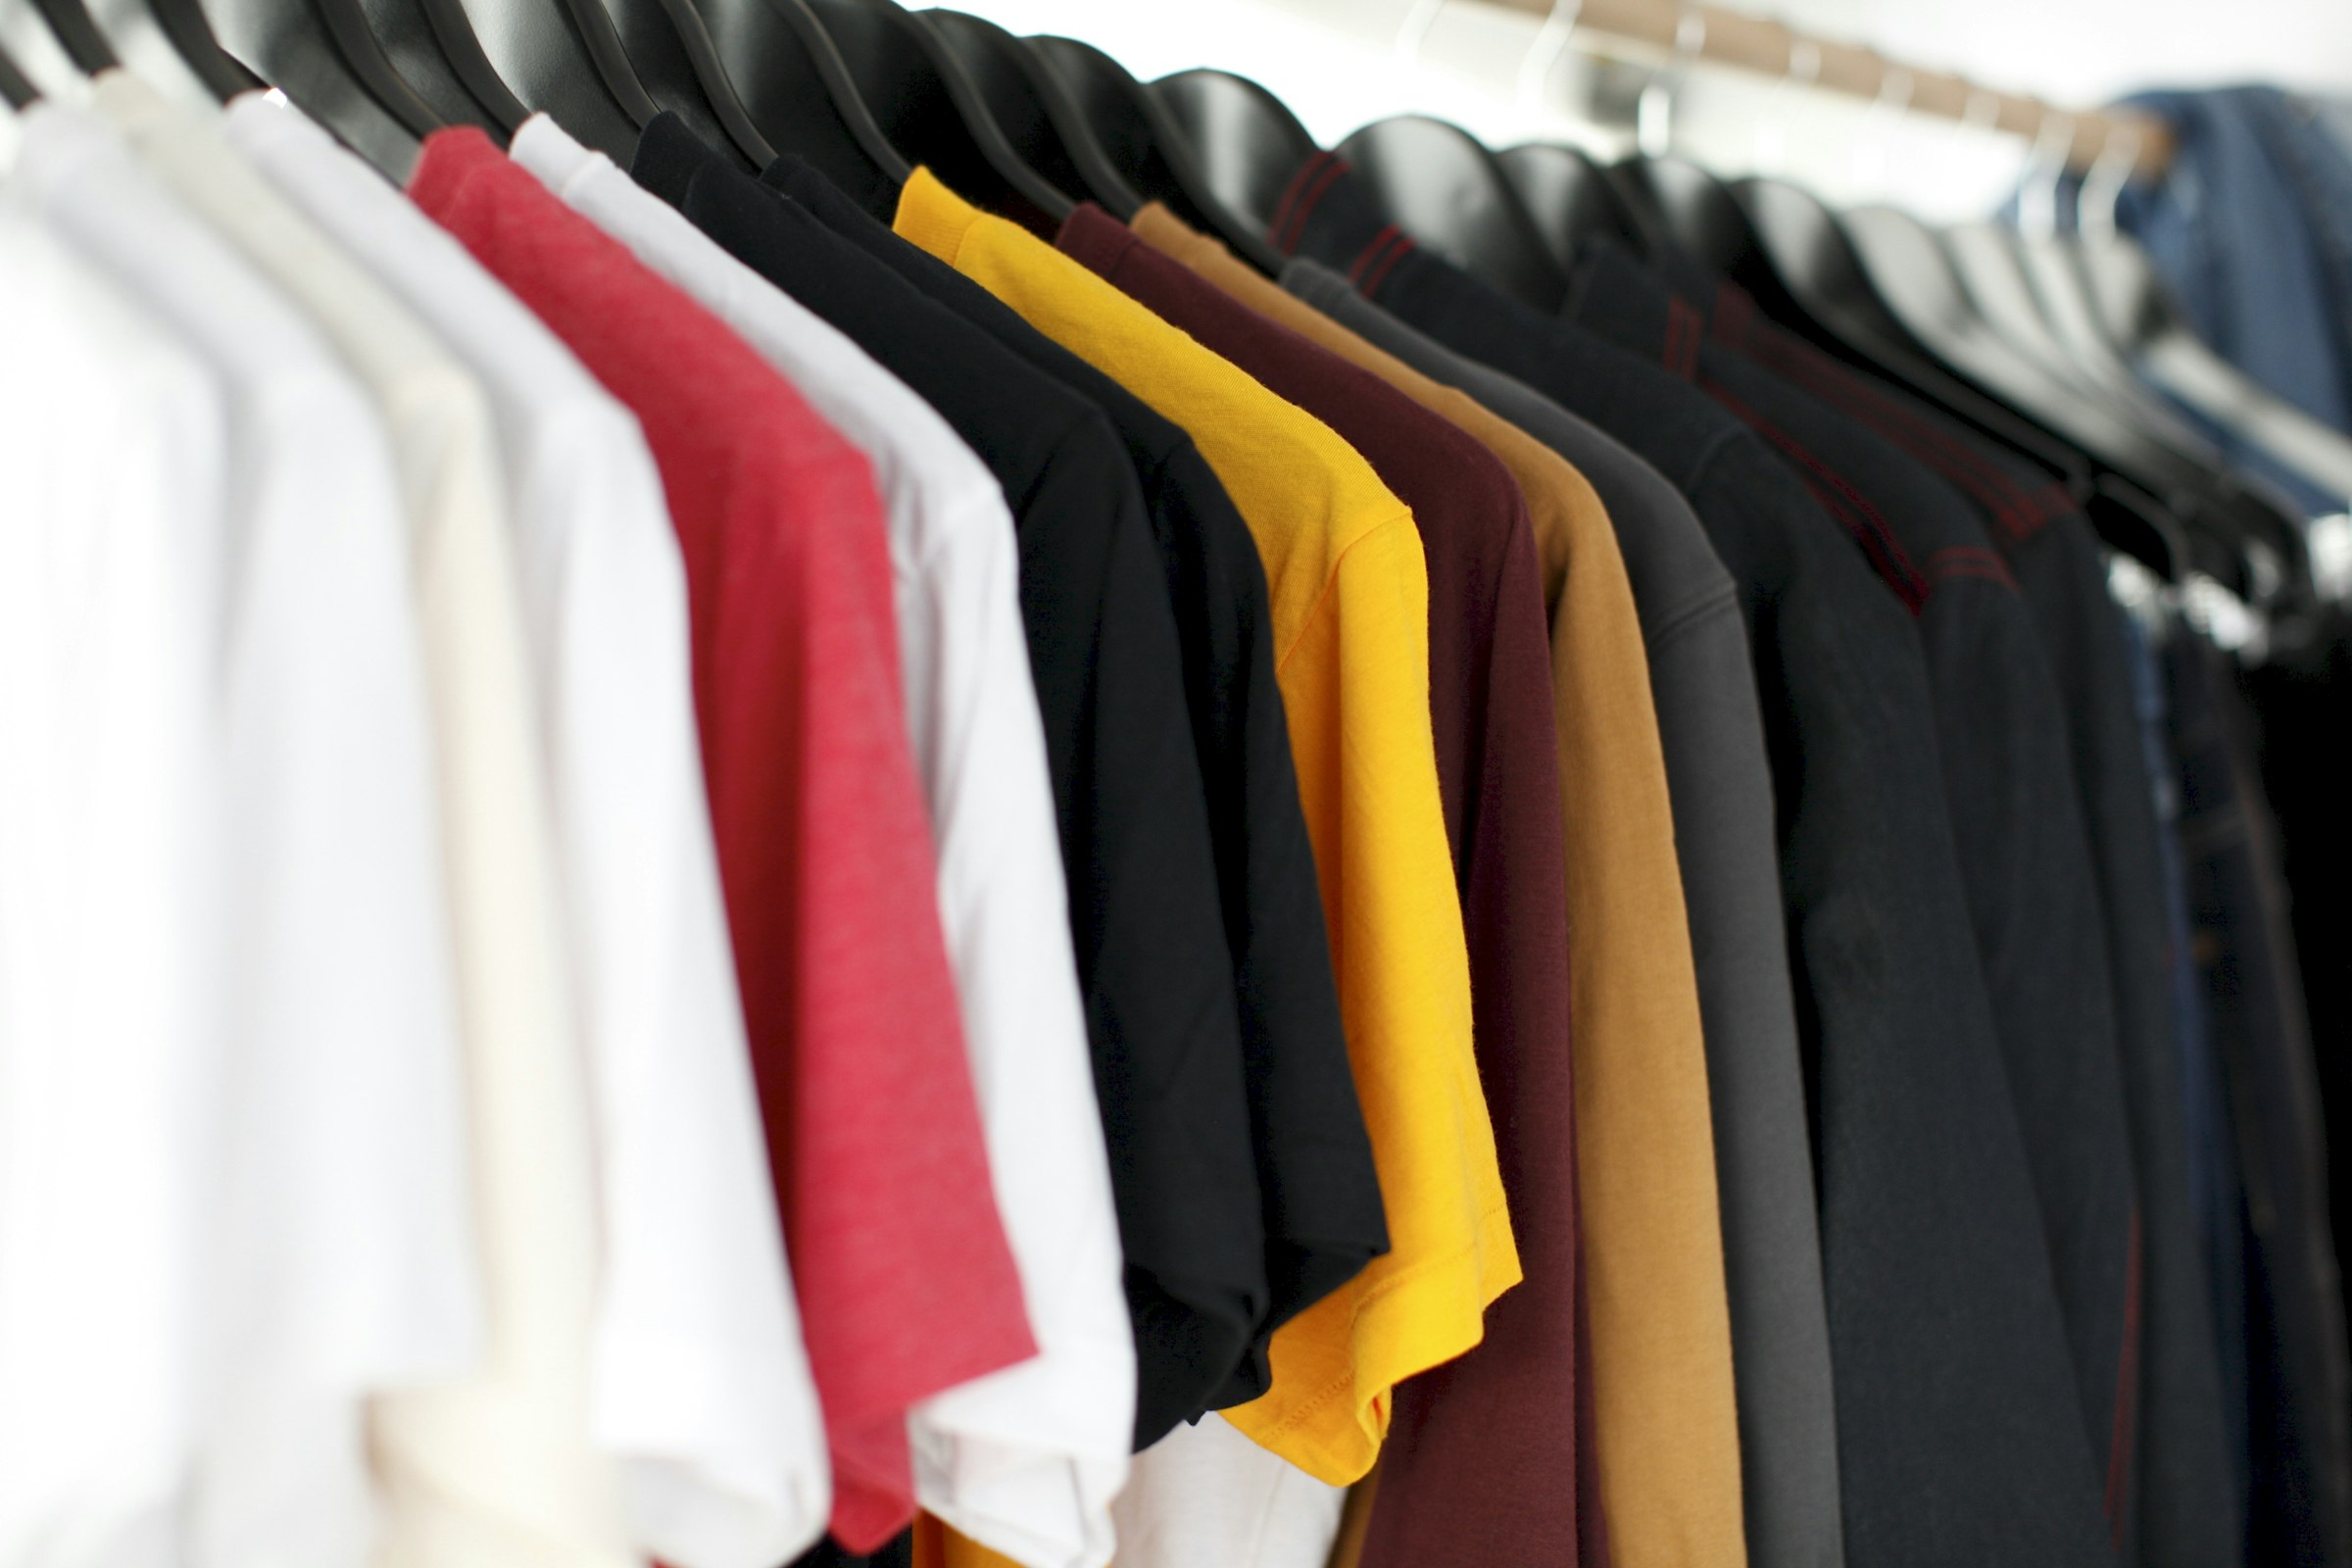
Until early 2025, the United States government could not tell you the price of a secondhand sweater.
Not because nobody asked. The Consumer Price Index prices a basket of things Americans buy, and for decades the only used goods in that basket were cars and trucks. Secondhand stores were counted for weighting — the Bureau of Labor Statistics knew people spent money there — but the stores themselves were ineligible for price collection. A thrift shop could not be sampled. In 2009, secondhand stores made up 0.0% of the women's apparel pricing sample. By 2021 they would have made up 1.5%, and the BLS finally incorporated secondhand apparel into the CPI in early 2025, using matched-model methodology with checklists for fabric, brand and condition.
That is a bureaucratic sentence describing something fairly startling: the official measurement of what clothing costs in America was corrected, within the last two years, to account for how an entire generation buys clothes.
It is worth sitting with, because it is a clean example of a general problem. The instruments that measure fashion were built for a retail economy, and Gen Z is not operating one.
There are three main instruments and each has a different blind spot.
The CPI now prices secondhand apparel, but only at stores. It is a price index, not a census of transactions.
The Census Bureau's Retail Trade Surveys, which produce the monthly retail sales numbers every trade publication runs, do not directly capture peer-to-peer sellers. Those get folded in annually through a separate program, Nonemployer Statistics, and benchmarked back into the monthly and quarterly series. Which means the fastest-moving part of the clothing economy arrives in the headline figure late and indirectly. (That description comes from an ICSC analysis of Census methodology — a careful one, but published in 2016. If you are going to cite it, cite it with the date attached.)
Card and transaction data, which is where most of the good recent work is coming from, sees only money that moves through a bank. Bank of America Institute's April read on secondhand fashion is explicit about this in its own methodology: it identifies payment inflows from secondhand retailers via debit card and ACH, and it excludes revenue that a seller leaves on the platform as credit toward another purchase. It also excludes donation-based charity thrift entirely, by design.
So: a price index that starts in 2025, a sales survey that reaches peer-to-peer on a lag, and transaction data that cannot see a Depop balance spent on Depop. Three instruments, three holes, and the holes are all in roughly the same place.
Quick disclosure before we go on: I'm building a wardrobe cataloguing app, so this argument runs directly past my own front door. Read the rest knowing that.
Now here is what the instruments can see, and it is the best data anyone has.
Among Bank of America's customers, Gen Z made up 41% of secondhand sellers year-to-date in 2026, up from 37% in 2024. Millennials averaged 38%, Gen X 14%. The number of Bank of America customers selling at secondhand retailers grew 16% year over year in March, and the average monthly amount earned was up 13% — a real jump after six roughly flat months.
That is the paragraph that gets turned into a headline about the side hustle. The next paragraph is the one that doesn't.
Almost 73% of those sellers sold once a quarter or once a month in the first quarter of 2026. The fastest growth is among people selling more than four times a month, but they remain a small slice. Bank of America's own reading is that this is still predominantly pocket change or participation in sustainability — a closet clean-out, not an income stream.
Both things are in the same report. Only one of them travels.
The buying side has the same shape. Secondhand transactions per household grew roughly nine times faster than secondhand spending in March — transactions up 27% year over year — while spending per transaction has been falling across every income group since April 2025, hardest at the bottom. More purchases, each one smaller. Gen Z was also the only generation to increase apparel spending growth across all three income cohorts in March, in a year where Bank of America describes the category as visibly K-shaped: luxury and discount up, department stores down 3.6%, teen retail down.
Put the two sides together and the picture is not a generation running a business. It is a generation transacting constantly in small amounts, in both directions, against a backdrop where apparel prices are about five times what they were a century ago and where 53% of Gen Z told Bank of America they are not earning enough to live the life they want.
They are not monetising their wardrobes. They are working the float.
The reason this matters more than a correction to a trend story is Gen Alpha, who are next and who are even harder to see.
The BCG and WWD study of 9,000-plus US consumers projects Gen Z and Gen Alpha driving 40% of fashion spending by 2035, already spending 7% more of their disposable income on clothes and shoes than earlier generations did. It also found them 20 percentage points less likely than older consumers to buy the same brand consistently — product-loyal rather than brand-loyal — and 41% of them using AI weekly to shop for fashion, against 34% of everyone else.
And then the measurement problem again, harder. Numerator put Gen Alpha's direct spending at more than $28 billion in 2024, with billions more in influenced purchases — purchases that are, in the data, a parent's transaction. A nine-year-old's taste is currently recorded as a thirty-eight-year-old's card swipe. There is no instrument for it at all.
So the industry is planning a decade around two cohorts whose behaviour it can see, at best, partially: one whose resale economy was not priceable by the federal government until eighteen months ago and whose platform credit is invisible to the best transaction data available, and one whose spending is legally and statistically somebody else's.
Everybody is going to keep publishing forecasts anyway. Read them knowing which parts of the picture the camera was pointed at.
- BLS incorporated secondhand apparel into the CPI in early 2025; previously only used cars and trucks were priced; secondhand stores counted for weighting but ineligible for pricing; matched-model methodology with checklists for fabric, brand, condition — Sarah A. Van Giezen, "Turning thrifty," Monthly Labor Review, BLS, May 2026
- Secondhand stores: 0.0% of the women's apparel CPI sample in 2009; would have been 1.5% in 2021 — Van Giezen, MLR, May 2026
- Peer-to-peer sellers not directly captured by the Retail Trade Surveys; captured via Nonemployer Statistics and benchmarked into monthly/quarterly results — Connolly & Gerlach, "Deconstructing the Census Bureau's Retail Trade E-Commerce Figures," ICSC, Fall 2016, p.17 n.17, verbatim [VERIFIED — but the source is from 2016. The body says so. Do not drop that caveat; Census methodology may have changed]
- BofA methodology: secondhand inflows identified via debit card and ACH; excludes revenue kept on-platform as credit; excludes donation-based charity thrift; market-driven platforms only — Bank of America Institute, "Secondhand fashion creates a closet refresh," 21 Apr 2026, Methodology section
- Gen Z 41% of secondhand sellers YTD 2026, up from 37% in 2024; Millennials 38%; Gen X 14% — BofA Institute, 21 Apr 2026, Exhibit 9
- Sellers +16% YoY in March; average amount earned +13% YoY, after ~six flat months — BofA Institute, 21 Apr 2026, Exhibit 8
- ~73% of sellers sold once a quarter or once a month in Q1 2026; fastest growth among those selling >4×/month; BofA reads this as pocket change / sustainability rather than income — BofA Institute, 21 Apr 2026, Exhibit 10 + text
- Secondhand transactions per household grew ~9× faster than secondhand spending in March; transactions +27% YoY; spending per transaction falling across all income groups since April 2025 — BofA Institute, 21 Apr 2026, Exhibits 5 and 6
- Gen Z the only generation to increase apparel spending growth across all income cohorts in March; department stores −3.6% YoY in Q1 2026; teen retail declined; overall clothing +5.1% YoY — BofA Institute, 21 Apr 2026, Exhibits 1–3
- Apparel prices ~5× higher than a century ago — BofA Institute, 21 Apr 2026, Exhibit 4, sourced to BLS CPI
- 53% of Gen Z say they are not earning enough to live the life they want — Attributed to Bank of America survey data via SoFi's generational spending roundup [VERIFIED (SECOND-HAND) — I could not reach the original BofA survey. Either pin it to the primary or cut the clause; the paragraph survives without it]
- Gen Z + Gen Alpha to drive 40% of fashion spending by 2035; spend 7% more of disposable income on clothing and shoes; 20pp less likely to buy the same brand consistently; 41% use AI weekly to shop fashion vs 34% of older generations; survey of 9,000+ US consumers and 50,000+ social posts — BCG × WWD, "How Gen Z and Gen Alpha Are Rewiring the Fashion Industry," 29 Oct 2025 [VERIFIED — note the study is from October 2025, not this season]
- Gen Alpha direct spending >$28B in 2024, plus billions in influenced purchases — Numerator, Shawn Paustian, 16 Sep 2025 [VERIFIED (VENDOR-PUBLISHED) — Numerator sells panel data; the figure is theirs and unaudited. Attributed in the body]
- "62% of Gen Z shopped secondhand in 2025" / "65%+ of Gen Z prefer thrift over new" — Surfaced in aggregator write-ups citing ThredUp's 2026 report; I could not find either figure in ThredUp's own release [UNVERIFIED — CUT. Do not restore. The second one in particular ("first generation to prefer secondhand over new") is a very large claim circulating without a primary]